
Thermal Imaging: Detecting Electrical Faults Before They Become Dangerous
What a Heat Camera Can Show You That Your Eyes Cannot
Introduction
Most electrical failures start quietly. A terminal screw loosens a little with each thermal expansion cycle. A circuit breaker carries more current than it was originally sized for. An aging contact slowly corrodes. In each case, electrical resistance rises—and wherever there is resistance under load, there is heat.
That heat is the crucial early warning. Left unattended, it damages cable insulation, trips protective switchgear, destroys costly machinery, sparks electrical fires, and halts factory production without notice. The core problem is that a failing connection looks completely normal to the human eye until catastrophic failure occurs. Infrared thermography enables engineers to visualize heat while there is still time to act.
How Thermal Imaging Works
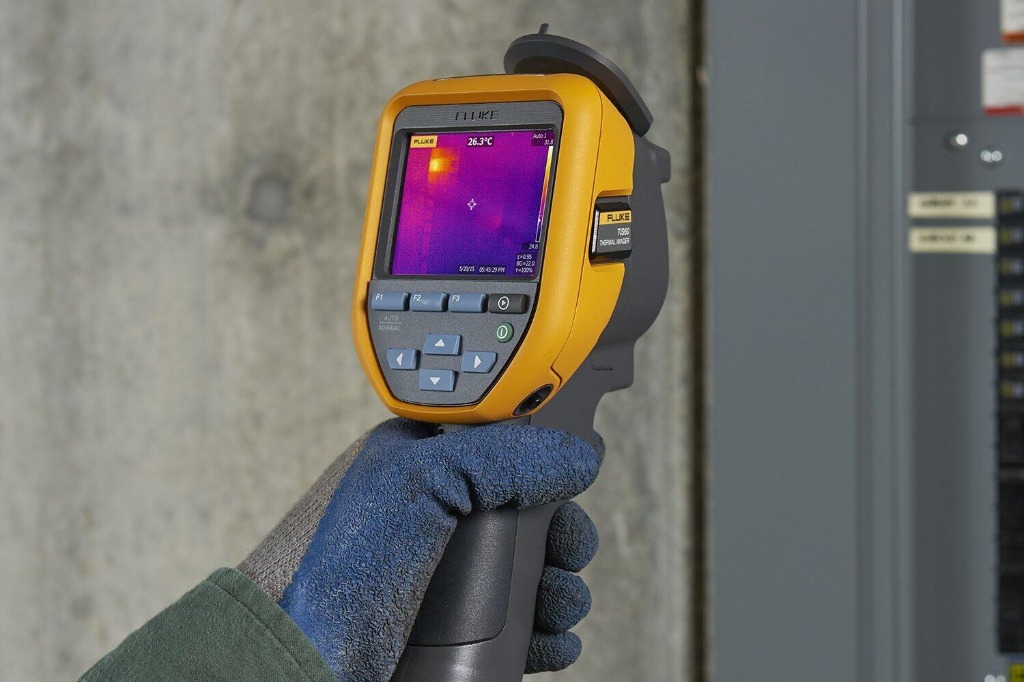
Every object above absolute zero emits infrared radiation; the hotter the object, the more radiation it radiates. While human eyes cannot perceive this spectrum, a thermal radiometric camera can. Its specialized Germanium lens focuses infrared energy onto a microbolometer detector array consisting of thousands of sensor pixels.
Each pixel generates an electrical signal that the camera's onboard DSP converts into an apparent surface temperature. The processor maps these temperatures to a calibrated color scale, producing a thermogram:
- Dual-Spectrum Blending: Modern industrial thermal imagers simultaneously capture a standard visible-light photo and blend it with the thermal overlay. This makes it effortless to pinpoint the exact loose terminal or phase lug on a crowded control panel.
- Key Principles: Thermal cameras measure the surface temperature of what they see—not the internal core of a component. Furthermore, false colors represent a relative temperature gradient: the temperature differential (ΔT) between adjacent phases matters far more than the visual color palette chosen.
Applications Across Industrial Plants
Because almost all electrical and mechanical degradation generates abnormal friction or resistance heat, thermography is indispensable across plant utilities:
- Electrical Panels, Breakers & Busbars: Detecting loose lugs, overloaded sub-circuits, and phase-load unbalance.
- Transformers: Identifying abnormal heating at high-voltage bushings, winding connections, and radiator cooling fins.
- Electric Motors & Bearings: Pinpointing worn bearing races, shaft misalignment, and blocked cooling fan cowlings.
- Industrial Heating Elements: Spotting burned-out elements or uneven heating profiles across heater banks.
- Power Distribution Switchgear: Detecting loose busbar splices, degraded knife-switch disconnects, and cable termination fatigue.
The Golden Rule of Thermography: Comparison is the primary diagnostic method. Inspect three identical phases or two identical motors running under identical loads—the phase or connection that displays a significant ΔT stands out immediately for investigation.
Real-World Case Example
The following scenario illustrates standard preventative thermography in a high-volume manufacturing environment:
During a routine quarterly inspection of a packaging line, a maintenance technician scanned a Motor Control Centre (MCC) while the line was operating under 80% nominal load.
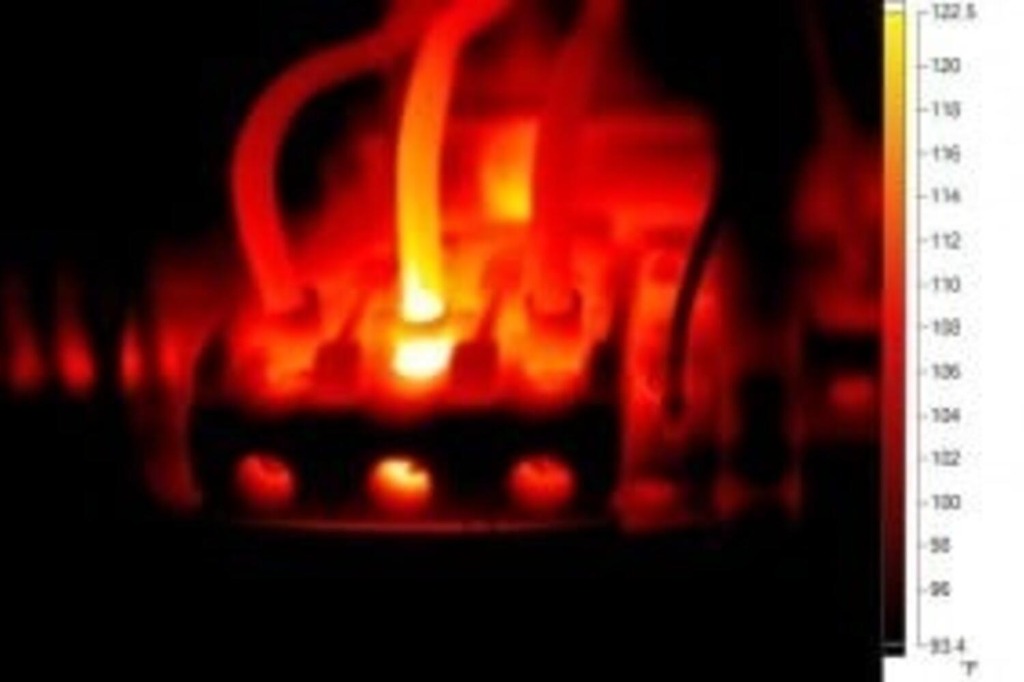
Two phases of a 45 kW motor starter displayed uniform temperatures (approx. 38°C). However, the third phase showed an intense, concentrated hot spot (exceeding 86°C) localized at a single conductor lug—nearly 50°C hotter than neighboring terminations.
Corrective Action:
- The technician recorded the radiometric thermogram, logged line load at 78 Amps, and flagged the bucket for immediate scheduling.
- During the next scheduled shift changeover, a qualified electrician isolated and locked out (LOTO) the circuit.
- Physical inspection revealed an under-torqued bolt and early conductor strand oxidation.
- The terminal was cleaned, re-crimped with fresh anti-oxidation paste, and torqued to manufacturer specifications with a calibrated torque wrench.
- Upon re-energization under full load, a follow-up thermal scan confirmed the hot spot had vanished, matching adjacent phases at 39°C.
Economic Impact: The planned repair required 45 minutes of scheduled downtime and cost virtually nothing in spare parts. Had the lug been left unaddressed, the terminal would have suffered thermal runaway, melting the starter casing, destroying the contactor, and inflicting 6 to 12 hours of unscheduled line stoppage during peak production.
Key Operational Benefits
- Predictive Maintenance: Repairs are scheduled based on actual thermal condition data, rather than reacting to catastrophic mid-shift breakdowns.
- Minimized Unplanned Downtime: High-risk faults are resolved during planned shift turnovers or scheduled maintenance windows.
- Enhanced Worker Safety: Inspections are conducted contactlessly from a safe distance outside the arc-flash boundary while switchgear remains energized under real operating load.
- Massive Cost Savings: A 30-minute terminal torque adjustment costs a tiny fraction of replacing melted motor starters or rebuilding fire-damaged distribution boards.
- Non-Invasive Inspection: Equipment does not need to be de-energized or disassembled simply to conduct routine diagnostic scans.
- Historical Trend Documentation: Archiving baseline thermograms creates an asset health ledger, allowing technicians to track thermal drift over years of machine operation.
Limitations & Engineering Precautions
Thermal imaging is powerful, but reliable diagnostics require understanding physical limitations:
- Surface Emissivity (ε): How efficiently a surface radiates infrared varies widely. Bare, polished copper or aluminum busbars have very low emissivity (ε ≈ 0.1), producing misleadingly low temperature readings. Technicians apply a piece of vinyl electrical tape or matte paint (ε ≈ 0.95) to obtain accurate radiometric measurements.
- Thermal Reflections: Shiny metallic surfaces can reflect radiant heat from nearby equipment or lighting, creating false "phantom" hot spots.
- Ambient & Environmental Variables: Strong drafts, solar radiation on outdoor switchgear, and ambient humidity can distort readings.
- Current Load Dependency: Thermal resistance anomalies only manifest when significant electrical current is flowing. Scanning an idle or lightly loaded circuit (< 40% load) can easily miss a severe defect.
- Surface-Only Limitation: Thermal cameras cannot see through closed metal panel doors or standard glass covers. Facilities should install infrared-transparent inspection windows to permit safe scanning without opening cabinet doors.
- Qualified Personnel: Thermograms indicate temperature differences, but do not replace electrical testing (megger, micro-ohmmeter). Findings must always be confirmed by licensed electricians following safety standards.
The Future of Thermal Inspection
Thermography is advancing through integration with modern Industrial IoT and AI architectures:
- Edge AI Automated Diagnostics: Onboard algorithms automatically classify hot spots according to severity standards, calculating ΔT against ambient without manual cursor placement.
- Permanently Mounted Fixed Continuous Cameras: Miniature thermal sensors continuously monitor high-criticality switchgear and main transformers, alerting maintenance via MQTT/Modbus if temperature exceeds thresholds.
- Autonomous Drone & Robotic Thermography: Drones and gantry robots inspect outdoor solar farms, high-voltage substations, and overhead cable trays without exposing personnel to heights or high-voltage risks.
- Unified Maintenance Platforms: Radiometric telemetry merges directly into computerized maintenance management systems (CMMS), triggering work orders automatically when anomalous thermal trends emerge.
Conclusion
Electrical failures rarely occur without warning—the warning is simply invisible to the human eye. Thermal imaging brings that hidden heat into plain sight. When integrated into regular maintenance rounds with proper operator training and consistent record-keeping, thermography transforms electrical maintenance from reactive firefighting into predictable, safe, and cost-effective asset management.
The best time to detect a high-resistance electrical fault is long before it finds you.
References & Industry Standards
- ISO 18434-1:2008: Condition monitoring and diagnostics of machines — Thermography — Part 1: General procedures.
- Fluke Corporation: What is Thermal Imaging? How Infrared Cameras Work and Hot Spot Detection.
- FLIR Systems: Thermal imaging for electrical and environmental inspections in industrial applications.
- NFPA 70B: Recommended Practice for Electrical Equipment Maintenance.
- NETA (InterNational Electrical Testing Association): Maintenance Testing Specifications for Electrical Power Distribution Equipment.